I’ve seen two examples of impressive live data visuals today, from two very different systems for very different projects from The Centre for Advanced Spatial Analysis (CASA) and French fashion retailer Pimkie.


Color Forecast
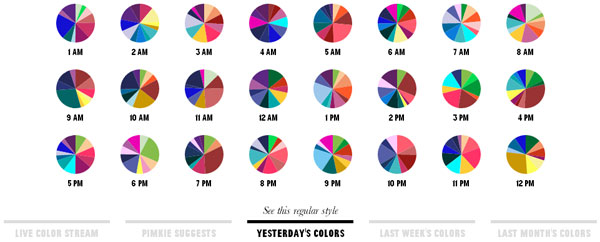
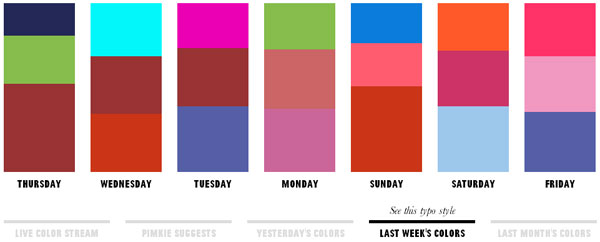
By analysing live webcam footage from Paris, Milan and Antwerp, this site collects colour information and presents it as trends for days, weeks and months.
www.pimkiecolorforecast.com found via www.springwise.com
London Data Table
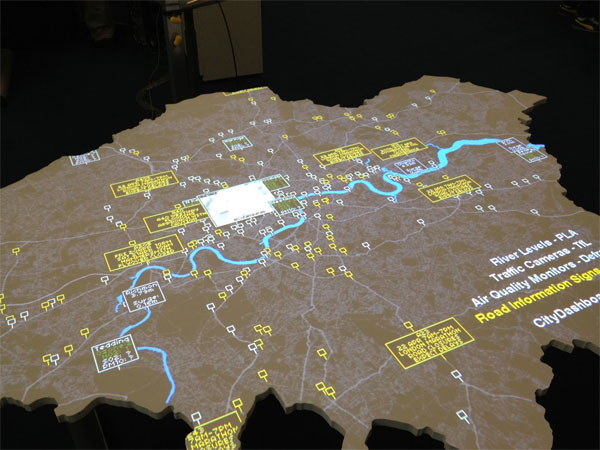
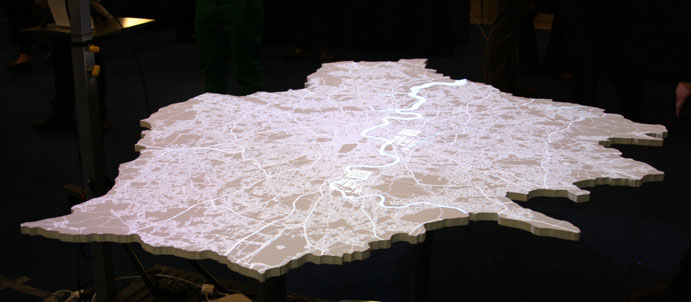
For a display at the Smart Cities, Bridging the Physical and Digital conference, the CASA team built a physical table of London, and projected real-time data of live aircraft positions, live traffic and bike hire usage to movies of public transport over 24 hours
Found via www.digitalurban.org and bigdatatoolkit.org
Leave a Reply